Supplementing aerial drone surveys with biotelemetry data validates wildlife detection probabilities
 Aliesha Hvala
 Rebecca M. Rogers
 Mamoun Alazab
 Hamish A. Campbell
- 1North Australia Centre for Autonomous Systems, Faculty of Science and Technology, Charles Darwin University, Darwin, NT, Australia
- 2Northern Territory Center for Cybersecurity & Innovation, Faculty of Science and Technology, Charles Darwin University, Darwin, NT, Australia
Aerial drone systems are now widely used to survey wildlife, but validation in the detectability of individuals is rarely assessed. This knowledge gap is critical, given the influence of local environments on wildlife detectability from the air. In this study, we integrated Animal Biotelemetry technology with aerial drones to evaluate the temporal and environmental factors influencing animal detection probability and subsequent population estimates. Wild-caught feral pigs (Sus scrofa) were fitted with GPS tracking collars and releasing them into a large natural habitat enclosure in northern Australia. Utilizing a fixed-wing drone equipped with a dual camera (thermal infrared and RGB), we conducted multiple flights over the study area during both wet and dry seasons, from sunrise to sunset. The study found that the probability that a pig was visible in aerial imagery was highly variable depending on the timing of the aerial survey. Detection probability was at its lowest during mid-afternoon (5 to 20%), while the early evening yielded the highest detection probability (50 to 75%). We observed seasonal differences, with detection probabilities exceeding 50% in the mornings of the wet season, in contrast to less than 30% during the dry season. Temporal trends in detection probability were similar in both thermal infrared and RGB imagery. The GPS location data enabled us to assess how localized factors (canopy cover, land cover, ambient temperature) altered animal detection probability. This information facilitated the identification of survey times to maximize feral pig detection and the development of a correction factor to account for non-detected individuals at specific times and locations. The study demonstrates the value of integrating Animal Biotelemetry technology and aerial drones to account for variations in detection probability when undertaking wildlife aerial surveys. Insights gained from this approach have implications for enhancing the accuracy of population assessments and contributing to more effective wildlife management and conservation.
1 Introduction
Assessing population abundance, distribution, and change over time is key to successful biodiversity conservation and management (Jachmann, 2001). Traditionally, broad-scale aerial surveys of wildlife have been undertaken by manned aircraft, with observers logging the locations of the animals as they see them (Caughley et al., 1976; Choquenot, 1995; Fewster and Pople, 2008). However, aerial drone systems are increasingly employed for aerial wildlife surveys because of significantly reduced operational costs and improved observer safety (Jones et al., 2006; Christie et al., 2016; Howell et al., 2021). Using pre-programmed flight modes allows aerial drone surveys to be highly repeatable and consistent and provides permanent digital records that can be stored and reanalyzed later (Hodgson et al., 2013; Hodgson et al., 2018). Aerial drone systems offer a versatile platform for wildlife data acquisition, providing the capability to attach various sensors to meet specific survey objectives (Christie et al., 2016). Depending on the application, each sensor has advantages and limitations (Wich and Koh, 2018). Visual imaging sensors, commonly used in wildlife surveys, capture high-resolution Red-Green-Blue (RGB) imagery that simulates human vision. However, these sensors have limitations in low-light conditions and may struggle to detect cryptic or camouflaged species in heterogeneous landscapes (Chrétien et al., 2016; Burke et al., 2019). Thermal infrared sensors convert infrared radiation into greyscale images, enabling the discrimination of warm-bodied animals from their surroundings (Havens and Sharp, 2015; Burke et al., 2019). While thermal infrared sensors are advantageous for detecting animals in low-contrast conditions (Beaver et al., 2020; McMahon et al., 2021; Sudholz et al., 2021), their spatial resolutions are comparatively low (640x512 pixels), making it challenging to differentiate species (Witczuk et al., 2018). Therefore, combining thermal infrared sensors with high-resolution visual imaging sensors offers a complementary approach to enhancing wildlife detection in aerial drone surveys (Chrétien et al., 2016; Brunton et al., 2020).
Despite significant technological advancement in drone-mounted sensors, the probability of detecting an animal from the air is still highly variable through space and time (Duffy et al., 2018). Vegetation (Chrétien et al., 2016; McMahon et al., 2021), weather conditions (Linchant et al., 2018; Sudholz et al., 2021), time of day (Patterson et al., 2015; Brunton et al., 2020), ambient temperature (Witczuk et al., 2018; Beaver et al., 2020), and drone flight parameters (Duffy et al., 2018; Whitworth et al., 2022). This can lead to both false negatives (not detecting the study species when it is there) and false positives (detecting the study species when it is not there), and ultimately incorrect abundance estimates (Brack et al., 2018). However, precisely determining the probability of these errors on a flight-by-flight basis is challenging, so has rarely been assessed.
Animal biotelemetry technology offers a promising solution to address the challenges posed by detectability and visibility biases in aerial drone surveys. This non-invasive technique involves attaching electronic devices to animals, allowing for the collection of data on their behavior, movements, and physiological parameters in their natural environments (Kays et al., 2015). The advent of satellite telemetry, combined with advances in receiver technology, battery life, and miniaturization, has dramatically increased the duration, frequency, and accuracy by which researchers and resource managers can record accurate geolocation from free-ranging animals (Tomkiewicz et al., 2010). As a result, tens of thousands of animals are tagged with telemetry devices each year (Campbell et al., 2015). The combined use of Global Positioning System (GPS) telemetry and camera data is increasingly recognized for its ability to enhance spatiotemporal inferences in wildlife monitoring and population trend assessment (Carter et al., 2022; Margenau et al., 2022; Stokes et al., 2023). GPS tracking devices provide precise location data about animal movements that complement the visual documentation obtained from camera data. By integrating data from both sources, researchers can achieve a more comprehensive understanding of animal populations, further minimizing uncertainty in abundance and density estimation.
In this study, we propose a collaborative approach integrating GPS telemetry to locate and identify multiple individuals within a survey area during aerial drone surveys. The likelihood of detecting the study species during each aerial sampling event is then calculated based on detection probabilities. We aimed to identify the temporal and environmental factors influencing wildlife detection probability using individual location data from GPS tracking collars. Our study focuses on feral pigs (Sus scrofa), an introduced ungulate species widely distributed throughout northern Australia’s tropical savanna region (Froese et al., 2017; Hone, 2020). Feral pigs adversely affect native ecosystems (Taylor et al., 2011) and biodiversity (Fordham et al., 2006), in addition to posing biosecurity risks to agricultural industries by their ability to transmit exotic diseases (Cowled et al., 2012; Horwood et al., 2018). The cryptic nature of feral pigs makes it challenging to monitor their populations and assess the impacts of conservation management strategies. As such, this study assessed an innovative approach to feral pig population monitoring that may also be applied to other species with similar characteristics.
2 Method
2.1 Study area
The study was conducted at the Charles Darwin University Katherine Rural Campus (KRC) in Katherine, Northern Territory, Australia (14°22’ 28” S, 132° 9’ 18” E; Figure 1). A monsoonal climate dominates the Katherine region, with two distinct seasons: the wet season (November-April) and the dry season (May-October). The wet season is a time of unstable atmospheric conditions due to high humidity (~70%) and above-average temperatures (28°C - 31°C). The region receives an average annual rainfall of 950 millimeters (mm), most of which falls during the wet season (station: 014932; Australian Bureau of Meteorology (2022)). In contrast, the dry season occurs with the onset of the prevailing south-easterly trade winds, characterized by dry conditions resulting in the absence of rain and relatively cooler temperatures averaging 22°C to 28°C.
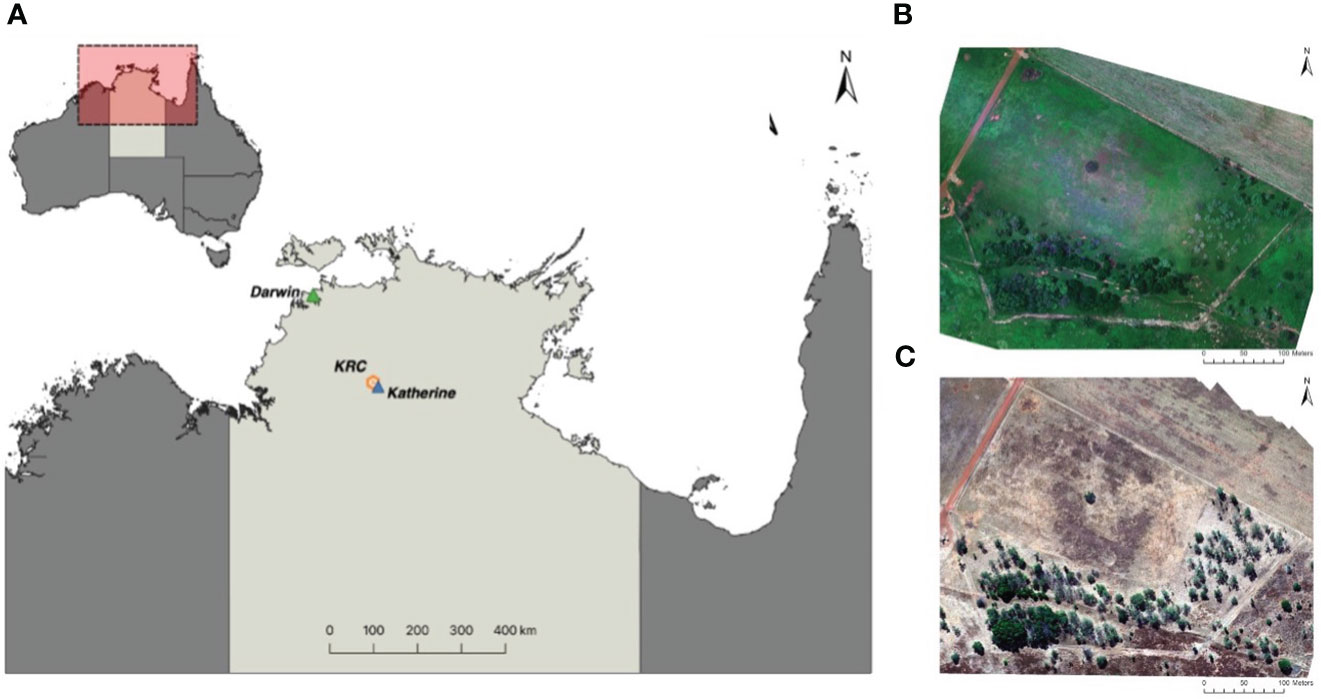
Figure 1 Map of the study area (A) located 300 km south of Darwin in the Northern Territory, Australia, at the Charles Darwin University Katherine Rural Campus (KRC). It also includes Red-Green-Blue orthomosaics generated using Agisoft Metashape Professional 1.8.3, depicting the survey area during the (B) wet season (February 2021) and (C) dry season (June 2022).
The drone surveys were conducted over a 20-acre enclosure containing semi-agricultural tropical savanna woodland habitats representative of the surrounding region. The habitat structure comprised a matrix of grazing pasture, native annual and perennial grassland, and eucalyptus-dominated mixed woodland with an ephemeral stream. Site elevations were relatively flat, ranging from 176 to 182 meters above sea level, with a maximum surface elevation of 204 meters, including vegetation. The enclosure was constructed with a customized pig-proof fence consisting of a barbed-top wire mesh fence, mesh skirting, solar-powered electrified bottom wire, and high gates.
2.2 Data collection
2.2.1 Telemetry system
Purpose-designed GPS tracking collars were fitted to a population of wild-caught feral pigs. The telemetry system was a GPS store-on-board unit (TGW-4200-4, Telonics Inc, Arizona, USA). These units have a GPS receiver, a VHF transmitter, and an ambient temperature sensor hermetically sealed into a single metal housing. GPS receivers were pre-programmed to attempt locational fixes at 3-minute intervals during periods when the aerial drone surveys were being undertaken (0500-0700, 0800-1000, 1400-1600 and 1800-2000 hours) deployed from January to February 2021 (wet season) and May to June (dry season) 2022. The collected data was stored in a non-volatile storage unit on each collar for retrieval upon recovery.
2.2.2 Feral pig capture and Animal Biotelemetry deployment
The feral pigs were live captured using corral traps set in savanna woodland habitat on the KRC property according to current best practices methods (Sharp, 2012). The corral traps were constructed of a welded metal frame (3.5 m (l) × 3.5 m (w) × 1.8 m (h)), rigid welded mesh fencing (50 × 50 mm mesh square size) and a rooter-type door. To familiarize pigs with the trap, the gates were propped open for more than seven days after construction and monitored daily. During this time, an automatic spin feeder dispensed bait (kernel corn) at 0600 hours each morning. The prop was removed once a sounder of feral pigs had become accustomed to the feeders. A total of 24 individuals were captured during the seasonal trapping events. GPS tracking collars were deployed on 16 feral pigs in total, but only seven collars were activated or retrieved successfully in both the wet season (n = 7) and dry season (n = 7). Each pig was directed down a single working chute and restrained with an animal handling pole featuring a noose that can be quickly tightened, locked, and released. The GPS tracking collars were snugly fitted around the animal’s neck, ensuring no irritating movement or rubbing occurred, allowing the animal to behave normally and without discomfort. The pigs were allowed a 7-day acclimation period to the enclosure before the study commenced.
2.2.3 Aerial drone system
Remote sensing images were collected using a commercial drone, the SenseFly eBee X (AgEagle Aerial Systems Inc, n.d.). This drone was selected for its modular design and durability. The system comprised a lightweight fixed-wing body (take-off weight 1.6kg) with a wingspan of 116cm, constructed from shock-absorbent drone fuselage with an underbelly made of reinforced polypropylene woven mesh (AgEagle Aerial Systems Inc, n.d.). The design supports hand-launching performed by the operator and landing accomplished through an automated belly slide. The Duet T camera system was installed in the drone’s internal payload bay to simultaneously capture high-resolution visual (RGB) and medium-resolution thermal infrared (greyscale) imaging data. The visual imaging sensor (S.O.D.A) has a resolution of 5472 x 3648 pixels and a 10.6 mm f/2.8-11 lens, while the thermal infrared (FLIR) sensor has a resolution of 640 x 512 pixels and a 13 mm, f/1.25 lens; both angled downwards. The eBee X was also equipped with a MicaSense RedEdge-MX high-resolution multispectral sensor which captures five narrow spectral bands to create natural and false color composites: blue (475 + 20 nm), green (560 + 20 nm), red (668 + 10 nm), red edge (717 + 10 nm), and near-infrared (840 + 40 nm).
Drone flights complied with the Civil Aviation Safety Regulations, 1998 and Part 101 (Unmanned Aircraft and Rockets) Manual of Standards Instrument, 2019 (Austl: NSW) regarding the operation of excluded RPA (sub-2 kg). The flights were conducted in the wet season (12-15 February 2021; total flights = 10) and the dry season (7-11 June 2022; total flights = 12). All flights were planned before deployment using eMotion flight management software and modified infield as required (AgEagle Aerial Systems Inc, n.d.). The drone flights were scheduled during four periods corresponding to the GPS receiver duty cycles: 0500-0600 hours (early morning), 0900-1000 hours (mid-morning), 1400-1500 hours (mid-afternoon), and 1800-1900 hours (early evening). These times were selected to provide an unbiased assessment of feral pig detectability by both camera types that may occur from only sampling in the early morning and early evening or during low-light conditions.
The Duet-T camera system was flown at ~52 meters above ground level (AGL) in parallel line transects, with all imagery captured in JPEG format. This altitude led to a ground sampling distance (GSD) of 1.18 cm/pixel for RGB imagery and 6.80 cm/pixels for thermal imagery. The wet season flights were programmed with a 70/70% overlap (~680 images/flight) to generate orthomosaics. However, in the dry season, a technical error prevented GPS image coordinates from being stored as exchangeable image files (Exif) data. Consequently, orthomosaics were not able to be created. In response, the flight plan was altered by lowering the overlap between images to 10/50% (~157 images per flight) to reduce the amount of redundant (duplicate) imagery while maintaining full coverage of the enclosure. A total of 14,870 thermal infrared and RGB images were collected during 22 aerial drone surveys conducted in both the wet season (k = 10; N = 11,066) and the dry season (k = 12; N = 3,804). Additional multispectral imagery was collected using the RedEdge-MX sensor to create high-resolution orthomosaics for seasonal land cover classifications. The RedEdge-MX sensor was deployed around midday to minimize the occurrence of long and dark shadows caused by low sun angles. This flight was conducted at 100 meters altitude, acquiring 756 overlapped images per band (75% overlap) with a GSD of 6.94 cm/pixel. As recommended by MicaSense, calibrated reflectance panel (CRP) images were captured before and after each flight to create reflectance-compensated outputs based on the day’s lighting conditions for image processing.
2.3 Data processing
2.3.1 Photogrammetry data
Multispectral drone-derived imagery was collated into seasonal RGB orthomosaics with Agisoft Metashape Professional 1.8.3 software (Figure 1; Agisoft LLC, 2022a). Processing workflow and parameter settings followed the Agisoft Metashape user guidelines for multispectral cameras (Agisoft LLC, 2022b). Multispectral imagery bands were calibrated radiometrically using the reflectance-compensated outputs, and the CRP albedo values provided by MicaSense as a CSV file with the panel. A Structure from Motion photogrammetric range imaging technique was used to create the orthomosaics. Structure from Motion is a method of approximating a three-dimensional structure of a scene from overlapping two-dimensional raster images (Zimmerman et al., 2020). To form the final orthomosaics, 2262 images were used from the red-green-blue channels; 4 to 6 images were excluded due to image quality and location. The orthomosaics were exported as a GeoTIFF for classification and final map generation in ArcGIS Pro 2.9 software (ESRI Inc., 2021).
Supervised classification was performed to define representative land cover classes using a maximum likelihood parametric rule on the orthomosaics. The raster imagery was classified into three primary types of land cover: canopy cover, grassland, and bare ground. In the wet season, a fourth class was assigned to water. For the supervised classification training samples, ~150 freehand and circular polygons of varying sizes were manually constructed per class to guide the classification algorithm. Training polygons were selected based on land cover grades and colours defining the study area. The raster land cover classification was then vectorized using the geoprocessing tool ‘raster to polygon’ to convert each land cover class into simplified polygons. To achieve a better classification result, polygons containing incorrectly classified pixels were manually reshaped, with attention paid to misclassified shadows in the dry season and canopy vegetation in the wet season.
2.3.2 Telemetry data
Data reports from each GPS tracking collar were manually downloaded and collated into a seasonal database. The GPS location datasets were cleaned to remove redundant information, unsuccessful detections, and GPS fixes with horizontal errors larger than 10 meters and filtered to align with the specific flight times obtained from the drone flight logs. The GPS location datasets were imported into ArcGIS as point feature classes and visualized over the RGB orthomosaics. Any residual points outside the enclosure boundary were removed. Using the geoprocessing tool ‘spatial join’, the point data features were matched to the land cover vector layer based on their relative spatial locations ‘within’ each class. The point data features were then exported in a table format for further data processing.
Using the point data tables with the added land cover values, we calculated the proportion of GPS detections classified as under canopy cover relative to the total number of GPS detections recorded for each individual per flight. The proportional scale (0.0-1.0) represents the extent to which open habitat (0.0) or closed woodland habitat (1.0) was used during a drone flight, referred to as ‘time under canopy cover’. Interpretation of this variable assumes the likelihood of obtaining an unobstructed aerial view of the pigs per survey.
2.3.3 Manual image classification
Thermal infrared datasets (greyscale images) were processed on a desktop using FLIR Research IR software (FLIR Systems Inc., USA) and converted to pseudo-colour images to enhance the appearance of thermal anomalies and body heat for assessment. Manual image analysis was carried out by a single analyst who had also processed the photogrammetry data. The imagery was reviewed twice to ensure all available feral pigs were detected. In cases where the thermal signature was unclear, a second analyst was consulted. Identifying characteristics of feral pig thermal signatures were defined by their cylindrical shape bodies akin to medium-grain rice and contrasting brightness. Two approaches were used to validate the identity of feral pigs in thermal infrared imagery. The first approach involved verifying thermal signatures from corresponding RGB imagery, light conditions permitting. The second method involved aligning GPS detections with observer detections using the GPS point data visualized in ArcGIS. The unique pig identifiers, GPS-fix times, and photo timestamps were used as references. Each feral pig was recorded as detected (1) or non-detected (0), aligned with the telemetry data. The RGB image datasets were reviewed and validated using the second method of aligning GPS detections with observer detections described above. All duplicate detections were recorded but omitted from statistical analysis.
2.3.4 Climate data
The climate data were obtained from the Tindal Royal Australian Air Force base (station number: 014932), located 29 kilometers from the survey site operated by the Australian Bureau of Meteorology (2022). The mean ambient temperature and relative humidity were calculated for each survey period. An additional measure of cloud cover was obtained and represented by the oktas scale, which ranges from 0 oktas (clear sky) to 8 oktas (overcast).
2.4 Statistical analysis
2.4.1 Probability of detection
Feral pig detection probabilities were calculated based on seasonal manual detection data acquired from the drone-derived thermal infrared and RGB imagery. The probability of detection (Pd) estimates the likelihood of feral pigs being detected within the survey area, where if P = 1 for all pigs, visibility bias was not present. As a result of the ground-truthing methods used, we assume that no false positives have occurred and that each detection accurately identifies a collared individual. The detection data were pooled from the flight replicates to form one detection history at each survey period per season. The probability of detection was then calculated by dividing the total number of feral pigs detected (ndetect) by the known number of feral pigs present in the survey area (Nobs) at a given time, expressed as:
2.4.2 Model fitting and selection
A model selection framework was used to investigate the influence of temporal and environmental factors on feral pig detectability for each camera type. All statistical analyses were conducted in R software v. 4.2.1 (R Core Team, 2022). A generalized linear model (GLM) was used to identify critical factors that explained the temporal variation in detection probabilities across seasons and time of day and to analyze the influence of environmental factors on the likelihood of detection. The models were developed using the “glm” function in the R package “glm2” (Marschner, 2011). Our initial approach used a generalized linear mixed model (GLMM). However, small sample sizes from early morning to mid-afternoon in the dry season led to ambiguous results when including the survey day as a random effect. For interpretive purposes, we changed our reference level to the evening survey period since both seasons showed equally high detection rates around this time. Model estimation was performed using maximum likelihood for both temporal and environmental data sets.
An information-theoretic approach was used to compare candidate models developed for the thermal infrared and RGB imagery data. The “check model” function in R package “performance” (Lüdecke et al., 2021) was used to conduct a visual check of the base data models for various assumptions (normality of random effects, linear relationship, homogeneity of variance, multicollinearity). In the environmental models, humidity showed high collinearity (VIF > 5) with the season and was excluded from thermal infrared and visual models. Several data sub-models were created with the remaining variables using the ‘dredge’ function in the ‘MuMIn’ R package (Bartoń, 2022) to identify the optimal combination of predictor factors for each response variable.
The Akaike’s Information Criterion corrected for small sample sizes (AICc) was used to assess the sub-models goodness of fit and parsimony (Burnham and Anderson, 2002). Sub-models with the lowest AICc score (ΔAICc< 2) and highest Akaike weight (ωi) were selected as the top-ranked models. Residual diagnostics for these models were assessed using the R package “DHARMa” (Hartig, 2022). The simulated scaled residuals were tested for homogeneity dispersion and temporal autocorrelation violation and plotted against each explanatory variable. In addition, we used an analysis of variance (ANOVA) to compare the two best-performing models with different variables. The confidence intervals (CI) were calculated for the top-performing models, and the logit scale was converted to odds ratios by exponentiating the estimates and CIs. The level of statistical significance was determined by P< 0.05.
To further examine if visibility bias varied between landcover classes, we analyzed the classified locations of GPS detections for the general population compared to the areas of drone-derived observer detections for each survey period and camera type. A simple linear regression was performed for this analysis. The residual plots were examined to confirm the random distribution of residuals. Finally, we conducted a Tukey’s honestly significant difference (HSD) analysis with the “TukeyHSD” function from the R package “Stats” (R Core Team, 2022) in conjunction with a one-way ANOVA. The Tukey’s HSD tests were performed separately for each season.
3 Results
3.1 GPS satellite tracking
The GPS tracking collars collected location fixes every three minutes, resulting in a total of 8050 obtained during the week of aerial drone survey in the wet (N = 4008) and dry seasons (N = 4042; Figure 2). These data points were subsequently filtered to align with the specific flight times of each aerial sampling event. In the wet season, we obtained eight to ten location fixes per individual during each flight (N= 660), while in the dry season, we obtained one to four location fixes (N=294). The number of location fixes per individual varied depending on the proportion of successful fixes and the flight duration. By utilizing this location data, the aerial image analyst was able to distinguish feral pigs detected in the thermal imagery from other species or objects that exhibited similar thermal signatures, such as Agile wallabies (Macropus agilis), termite mounds, tree bark, hollowed tree trunks, and to filter duplicate feral pig detections between overlapping thermal infrared and RGB images.
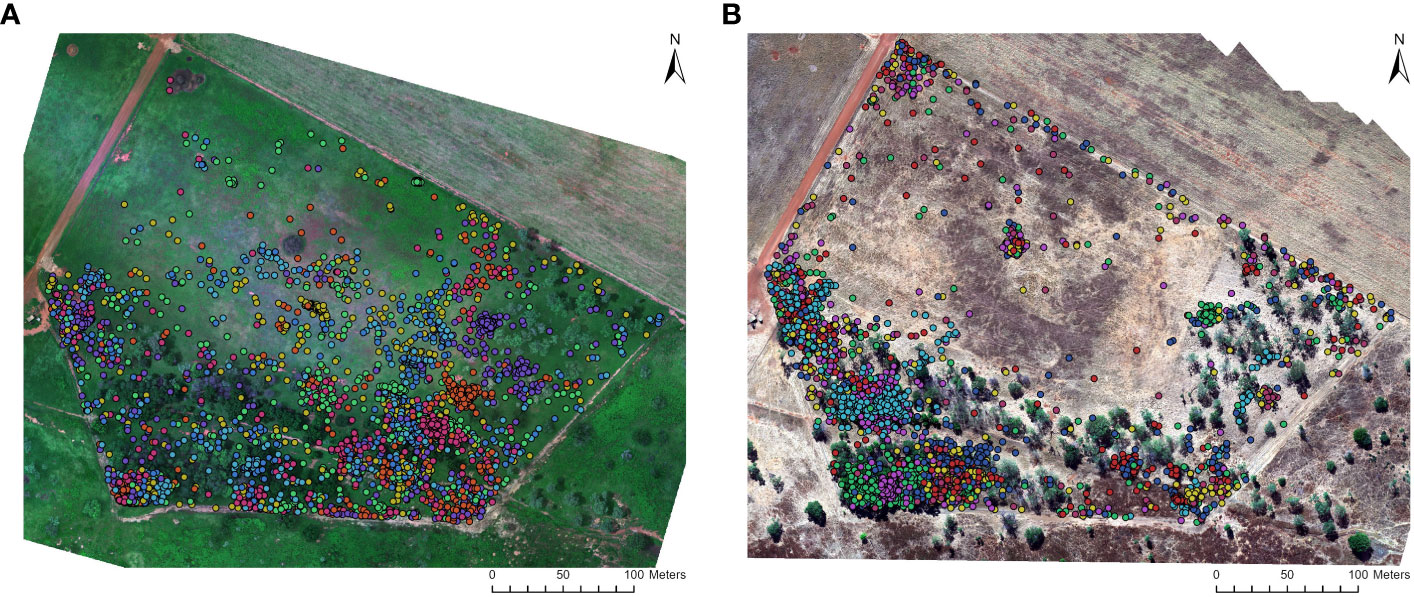
Figure 2 Location data of GPS collared feral pigs within the survey area at the Charles Darwin University Katherine Rural Campus (KRC). The data is presented for two seasons: (A) wet season (February 2021; N = 4008) and (B) dry season (June 2022; N = 4042). The GPS collars provided location fix rates at 3-minute intervals during preprogrammed sampling periods. Each colored point represents a GPS-collared feral pig, allowing for the differentiation and tracking of individual animals.
3.2 Temporal influences on detectability by aerial drone systems
Season strongly predicted feral pig detectability by thermal infrared and RGB imagery (Table 1). Detection rates were 23.1% higher by RGB imagery and 22.1% higher by thermal infrared imagery in the wet season than in the dry season (Figure 3). Time of day was also a significant predictor of feral pig detection, with effects observed for thermal infrared imagery in mid-morning and mid-afternoon, and for RGB imagery during all survey periods. As early morning light conditions were too low to evaluate RGB imagery in the dry season, all feral pigs were recorded as present but undetected at this time. The probability of detection by thermal infrared imagery was significantly higher during the wet season in the early morning and mid-morning compared to the dry season. While detection probabilities were very low in the mid-afternoon for both seasons and camera types, ranging between 4.8-14.3%. Conversely, the likelihood of detection by RGB imagery was highest in the early evening of both the wet and dry seasons. During this time, thermal infrared imagery recorded an average of 20% fewer detections.
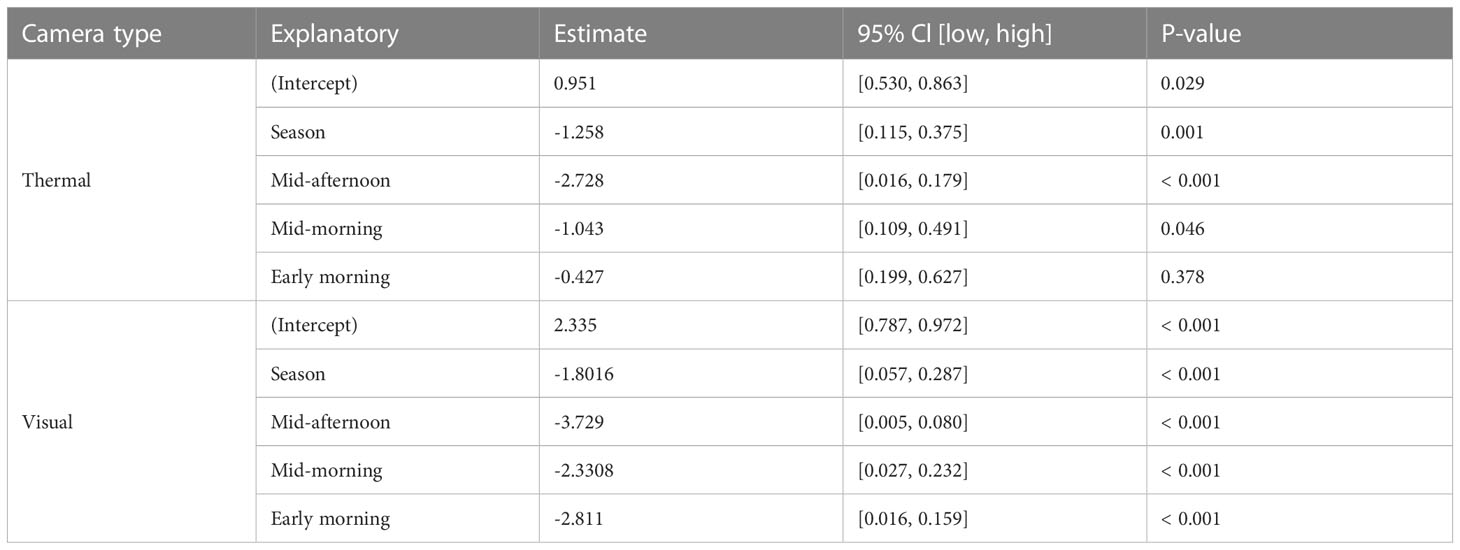
Table 1 The results from the best-performing generalized linear models to investigate the seasonal and diurnal influence on feral pig detectability with thermal and visual cameras.
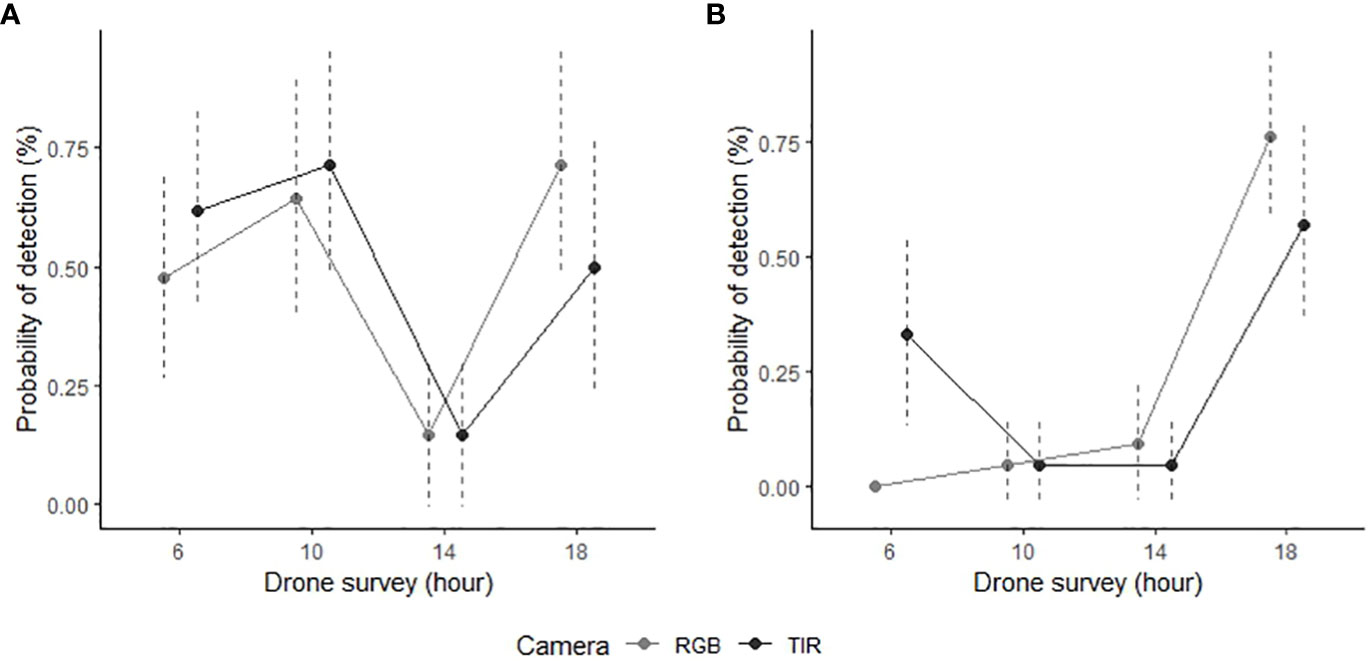
Figure 3 Manual detection success of GPS collared feral pigs during aerial drone surveys conducted in the Northern Territory, Australia. The data is presented for two survey periods: (A) wet season (n = 7; February 2021) and (B) dry season (n = 7; June 2022). Feral pig detections are derived from RGB (light grey) and thermal infrared imagery (dark grey) captured by the drone, displayed with 95% confidence intervals (dotted line).
3.3 Environmental factors influencing detectability by aerial survey
The proportion of time pigs spent under canopy cover strongly predicted detectability by thermal infrared and RGB imagery (Table 2). A strong negative relationship was modelled for both camera types, demonstrating an overall decline in feral pig detectability with increased time spent under canopy cover during a drone survey (Figure 4). In the dry season, feral pigs spent an average of 78-92% of their time under canopy cover between early morning and mid-afternoon when detection rates were lowest and 25% of their time in the early evening when detection rates were highest. By comparison, feral pigs spend less time under canopy cover in the wet season. Feral pigs spent approximately 62% of their time under canopy cover in the mid-afternoon when detection rates were lowest and 17-34% in the early morning, mid-morning, and early evening when detection rates were highest. Feral pig detection for thermal infrared and RGB imagery was not significantly different for other landcover classes (Figure 5). Ambient temperature was also a significant predictor of feral pig detection by thermal infrared imagery (Table 2). A negative relationship was modelled, demonstrating that the probability of detection by thermal imaging decreased with increasing ambient temperatures (Figure 6). Ambient temperature was not significant for RGB imagery. There was an indirect influence of ambient temperature and canopy cover on feral pig detectability in the mid-afternoon for both camera types. During this survey period, the highest ambient temperatures were recorded for both the wet (mean ± SD = 30.5 ± 2.6°C) and dry seasons (mean ± SD = 30.9 ± 3.2°C), corresponding to when pigs spent the most time under canopy cover, and when detection rates were lowest.
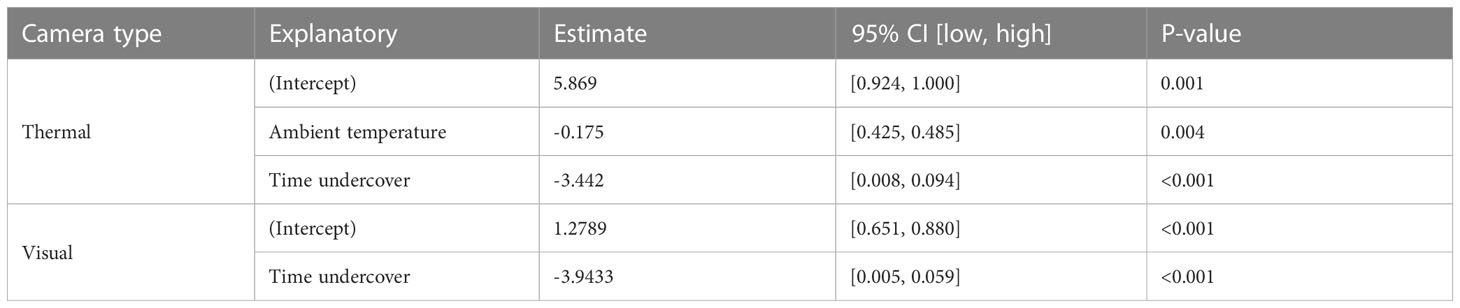
Table 2 The results from the best-performing generalized linear models to investigate the seasonal and diurnal influence on feral pig detectability with thermal and visual cameras.
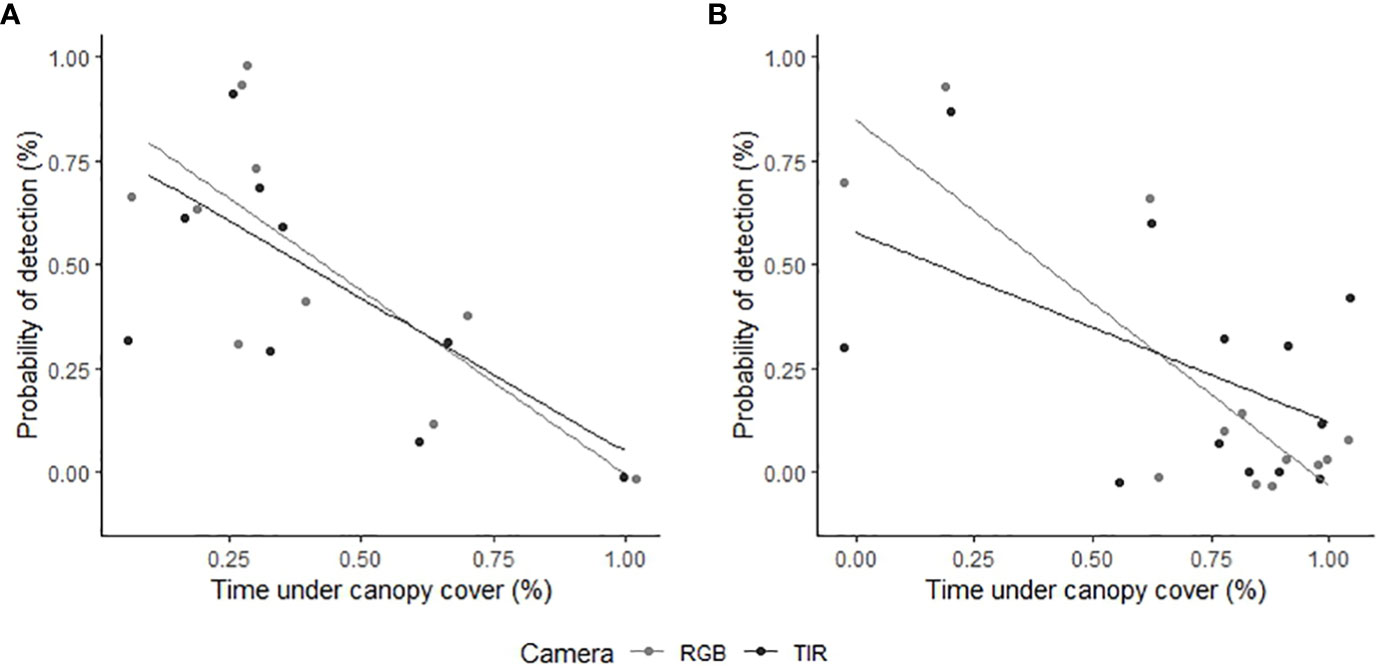
Figure 4 The relationship between feral pig detection probabilities using RGB (light grey) or thermal infrared imagery (dark grey) and the proportion of time feral pigs spent under canopy cover. We analyzed feral pig detections during the (A) wet season (February 2021) and (B) dry season (June 2022). The time spent under canopy cover was determined using GPS location data and was compared to the overall probability of observing the feral pigs outside of canopy cover during aerial drone surveys. Feral pig detections are represented as raw values (points) on the y-axis, indicating the proportion detected for each flight.
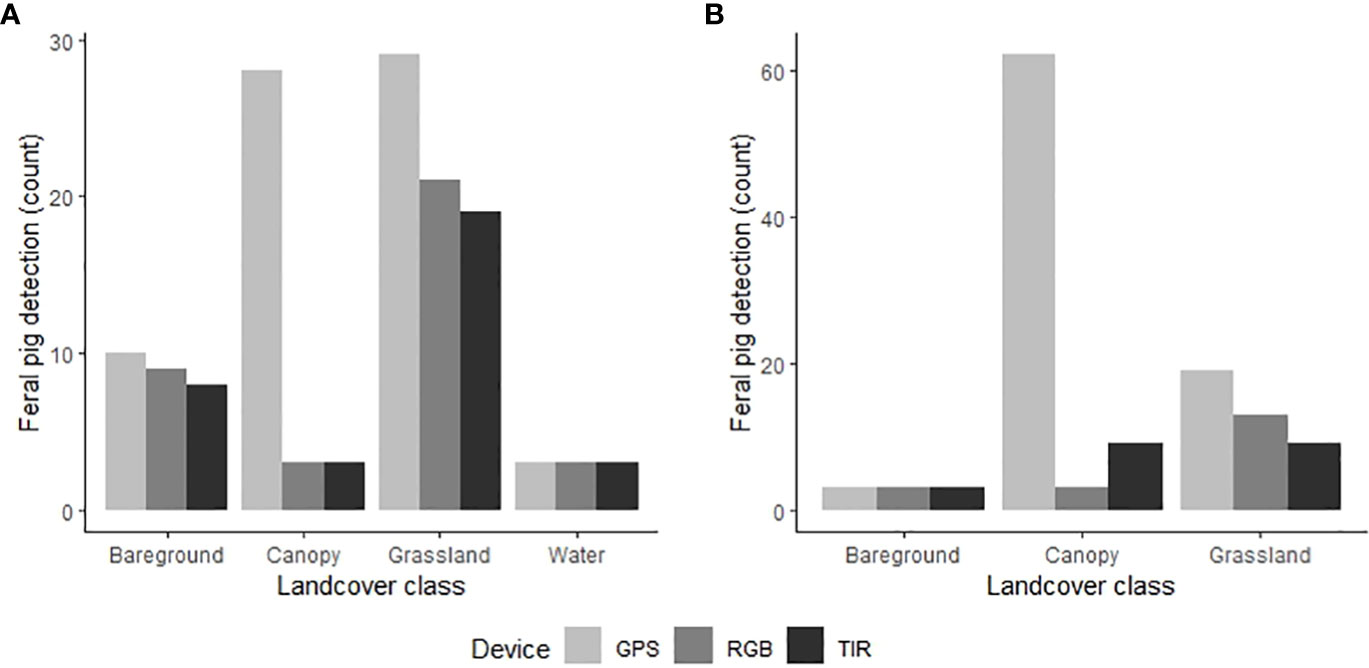
Figure 5 Comparison of the GPS locations of the known feral pig population (light grey) and the drone-derived detections from thermal infrared (dark grey) and RGB imagery (grey) in the (A) wet season (N=70) and (B) dry season (N=84). Feral pig detections are plotted on the y‐axis as the total count of pigs detected within each land cover class across all seasonal drone surveys.
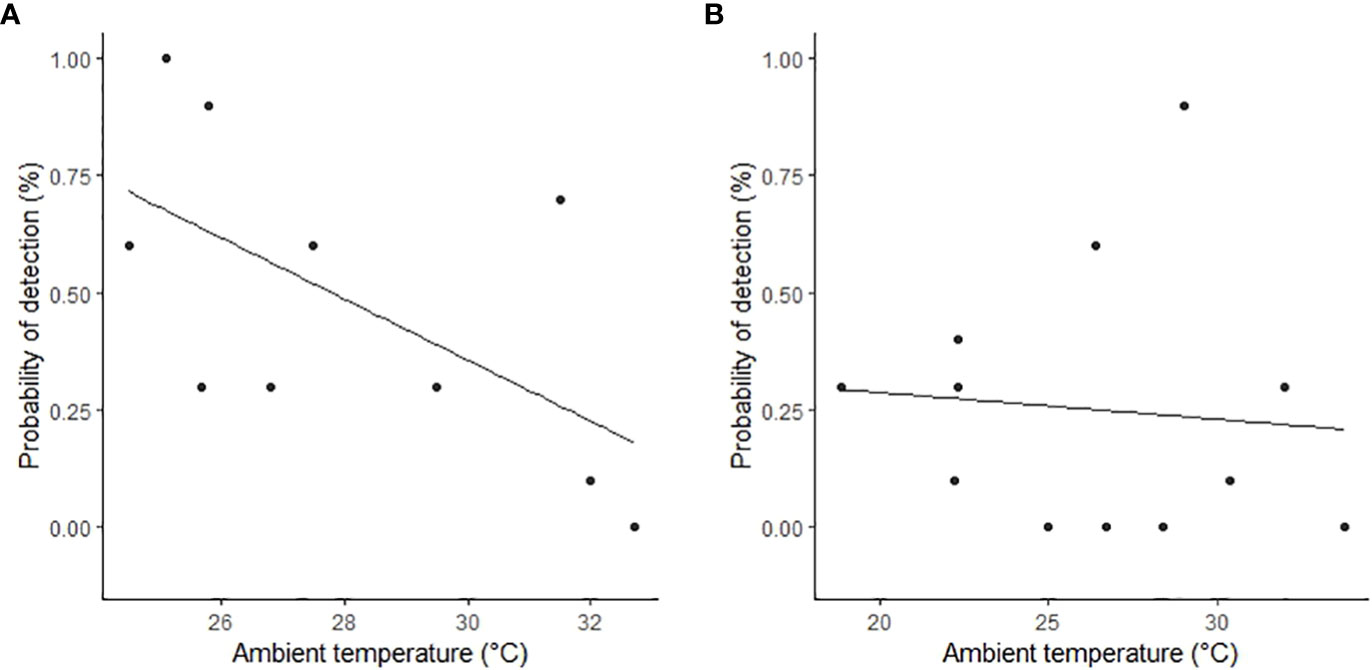
Figure 6 The relationship between feral pig detection probabilities by thermal infrared imagery and mean ambient temperature in the (A) wet season (February 2021) and (B) dry season (June 2022). Feral pig detections are plotted as raw values (points) on the y‐axis as the proportion detected for each flight.
4 Discussion
The Animal Biotelemetry location data showed that the detection of feral pigs in their natural environment using aerial drone systems varied significantly depending on the timing of the survey. During mid-afternoon surveys, both thermal infrared and visual imaging sensors exhibited poor performance in detecting feral pigs, resulting in data that would be insufficient for estimating abundance and distribution. The study further supports that environmental factors influence drone-based animal abundance estimation (Linchant et al., 2018; McMahon et al., 2021). However, it demonstrated that these factors differ over short-term temporal scales, and thus, survey timing had confounding effects on wildlife abundance estimation. Attaching GPS tracking collars to a set number of individuals within a defined survey area made it possible to determine the probability of detecting feral pigs during each seasonal aerial sampling event. Individual GPS locations provided the opportunity to examine visibility bias and determine the reasons for failing to detect a feral pig in thermal infrared and RGB images. GPS tracking was instrumental in enhancing the accuracy and reliability of these insights by providing a method to validate observer detections. Without GPS location information, the probability of feral pig detection and the limitations of detection capabilities would have remained uncertain. As such, the collaboration between those versed in Animal Biotelemetry and aerial drone systems offers significant potential for accurate wildlife abundance assessments of cryptic species.
Animal Biotelemetry technology for most wildlife can now be purchased off-the-shelf. These devices have significantly reduced costs in terms of hardware and data transfer in recent years (Jung et al., 2018). Even relatively small devices can now provide frequent accurate geolocations of individuals over many years (depending on animal body size). Animal Biotelemetry is, however, challenging to apply correctly, and detailed biological knowledge of the study species is required before the attachment of a device can be attempted. Animal ethics and permits are typically required and sometimes the presence of a veterinary surgeon is required. Therefore, collaboration between practitioners of Animal Biotelemetry and users of aerial drone systems may be necessary to enable successful and safe roll-out and data collection.
Animal Biotelemetry provides data on an individual’s movement, association with other tagged individuals, and activity space and habitat usage (Kays et al., 2015). It does not generally provide information on abundance and density distributions. Thus, by integrating the abundance and density information supplied by aerial drone surveys, a more holistic model of the species ecology can be developed. We recommend capturing GPS fixes at shorter intervals, from one to three minutes, to optimize alignment between GPS tracking and drone-derived detections. This higher frequency of data collection, particularly for highly mobile species such as feral pigs, can significantly improve the accuracy and precision of the gathered information.
GPS tracking enabled us to determine the optimal time of day and year for conducting aerial drone surveys to maximize the likelihood of detecting feral pigs. Considering individual pig locations, particularly those undetected by the observer, provided further context for understanding how environmental conditions can affect detectability (Figure 7). Canopy cover was a prominent source of visibility bias across both seasons and sensors, hindering our ability to detect completely obscured pigs (McMahon et al., 2021). In some cases, individuals located near the canopy edge or under defoliated trees could still be detected with thermal infrared and identified by RGB imagery. Diffuse light created by cloudy conditions or low sun angles with minimal cloud cover offered the best conditions for detecting feral pigs outside of cover than full sunlight. This was likely due to reduced discriminative shadows and decreased solar radiation or reflectance from inanimate objects (Linchant et al., 2018; Burke et al., 2019). During the wet season, high cloud cover minimized the effects of solar radiation on the surrounding environment, producing thermal infrared images with homogeneous backgrounds. Conversely, in the dry season, clear skies with direct sunlight caused significant background cluttering in thermal infrared imagery, with hollowed tree trunks, tree bark, bare ground and termite mounds contributing to thermal heterogeneity. Consequentially, this obscured the thermal signatures of feral pigs close to these features. In the early evenings, soft sunlight from lower sun angles produced high-quality RGB imagery, allowing dark pig bodies to stand out against neutral backgrounds.
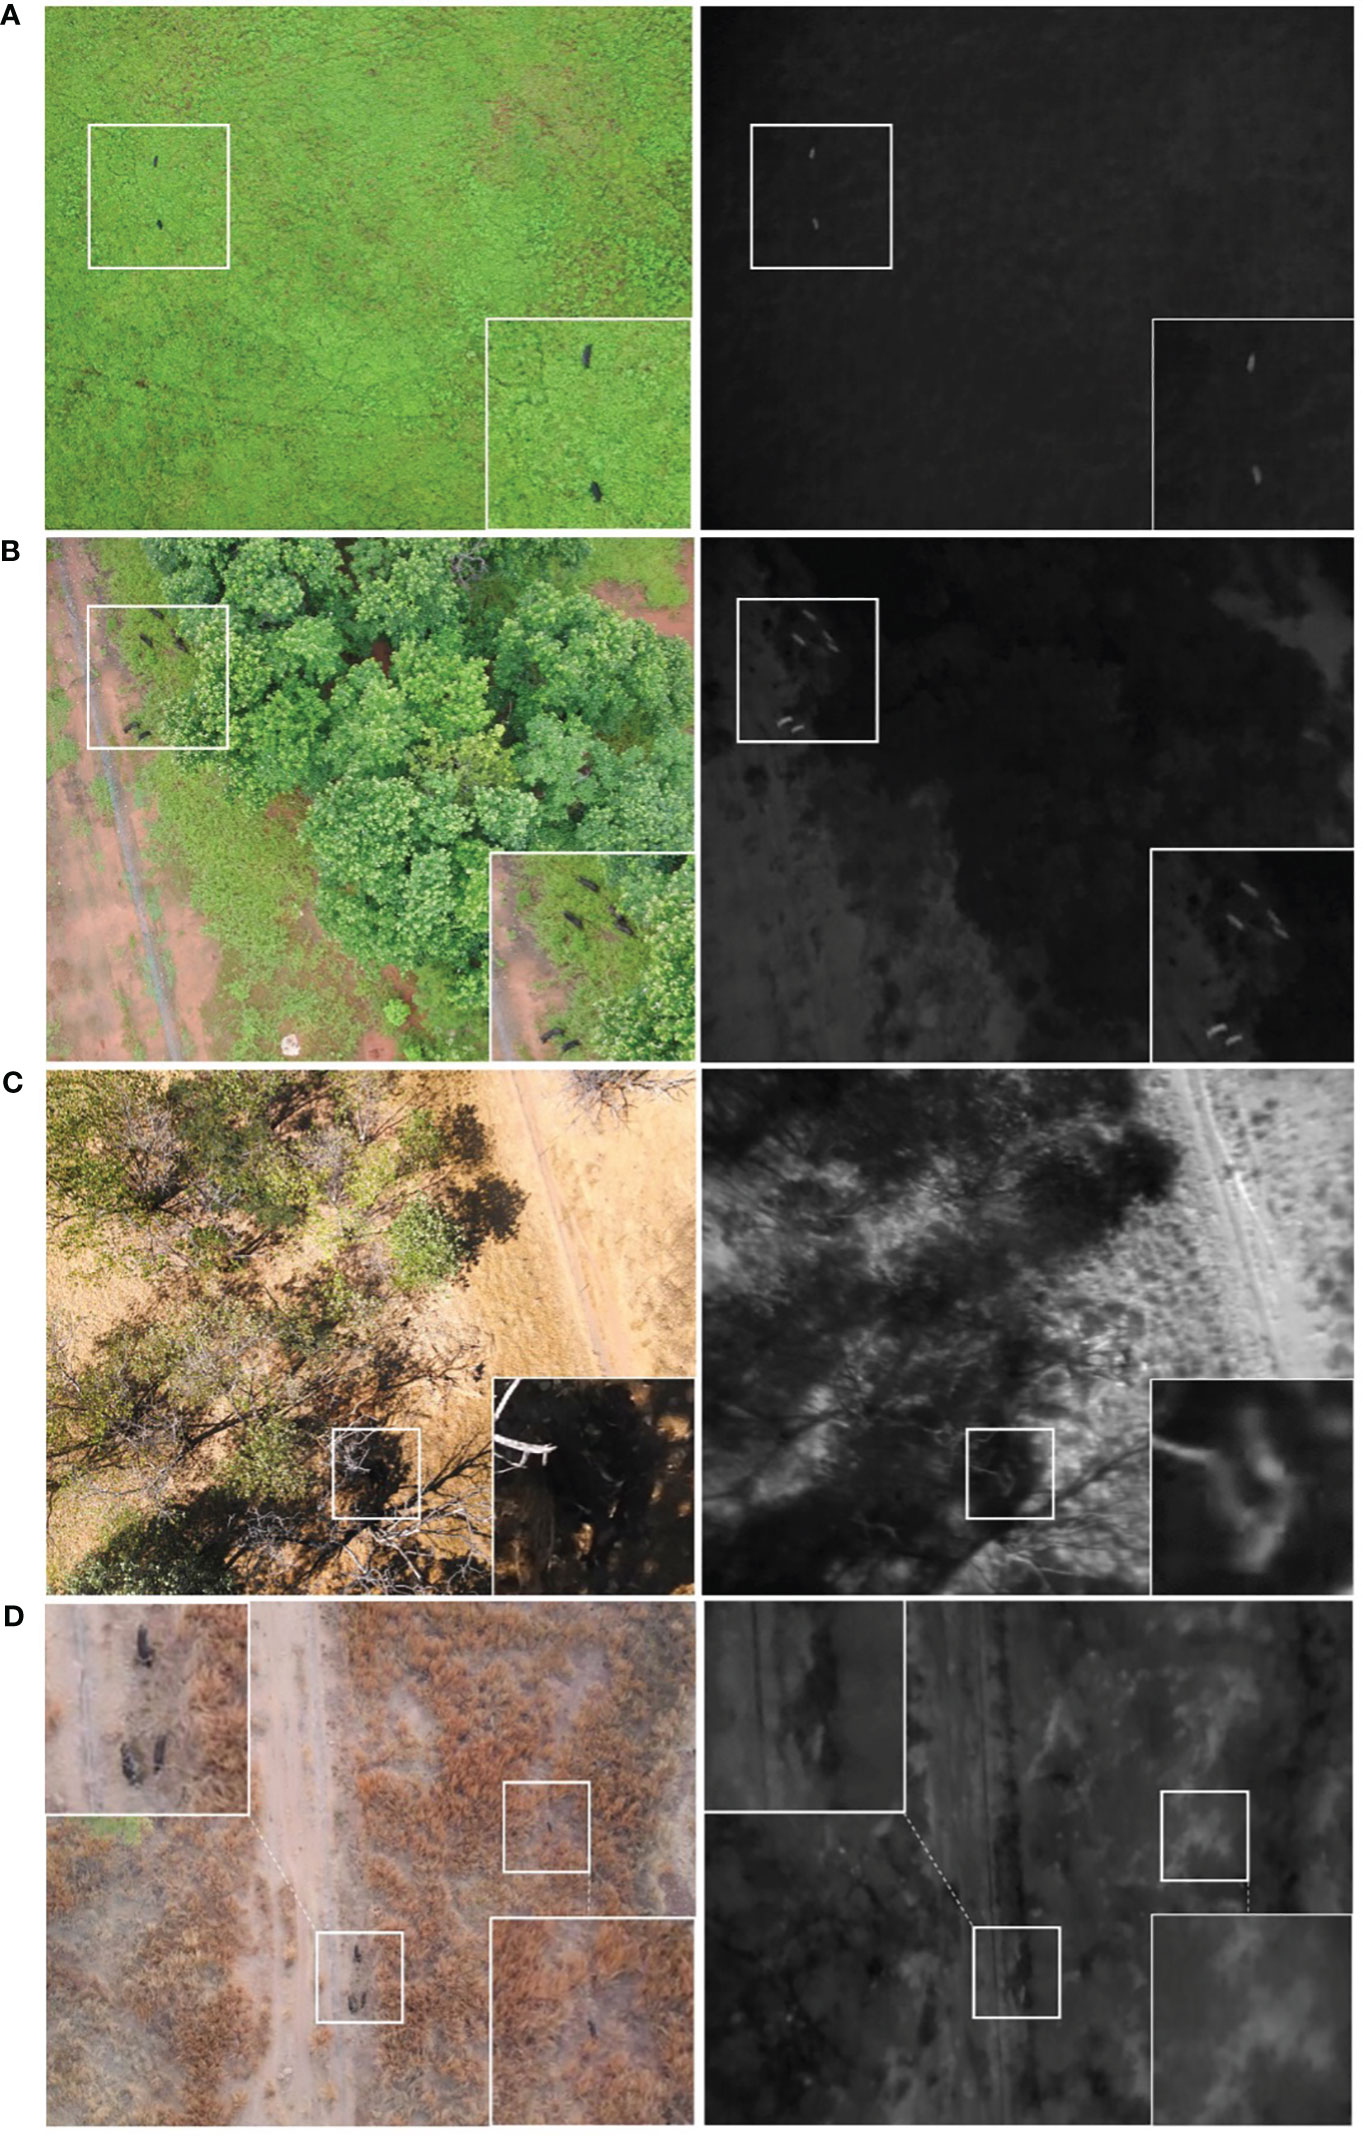
Figure 7 A side-by-side comparison of RGB and thermal infrared (greyscale) images of GPS-collared feral pigs collected at the Charles Darwin University Katherine Rural Campus, Northern Territory, Australia. These images illustrate feral pigs detected under different conditions: (A) high cloud cover in the wet season at 0600 hours, (B) dense vegetation parameters in the wet season at 1000 hours, (C) clear sky with direct sunlight in the dry season at 1400 hours, and (D) clear sky with low sun angles in the dry season at 1800 hours. In Image (D), four feral pigs are present in the RGB image, while only two were manually detected in the thermal infrared image.
As a future direction for this application, Artificial Intelligence (AI) holds great promise for the automated detection, classification and identification of animals in aerial drone surveys (Gonzalez et al., 2016; Santangeli et al., 2020; Lenzi et al., 2023). These systems entirely automate wildlife survey counts from the aerial imagery (thermal infrared and RGB), offering significant potential for wildlife conservation and management across broad scales. However, the effectiveness of AI routines for automating object classification is still hindered by challenges related to the visibility of study species and the quality of training data. Factors such as lighting conditions, camera angles, and occlusions contribute to these limitations. This is where GPS telemetry could be helpful. GPS location data provided confirmed locations of feral pigs within multiple images, which can act as reference objects within the classification process. This would allow the AI model to learn and identify the specific characteristics of the study species in different environments and conditions, making it more adaptable and accurate in detecting feral pigs in the field. Additionally, location data can help account for the variability in thermal signatures, which can change due to factors such as ambient temperature as well as phenotypic characteristics of the animal (Havens and Sharp, 2015).
In conclusion, integrating individual location data obtained through Animal Biotelemetry technology can significantly enhance wildlife abundance and density estimates derived from aerial drone surveys. As the technology of these two fields continues to advance, collaboration between researchers in these fields is imperative to maximize the benefits of wildlife conservation and management.
Data availability statement
The raw data supporting the conclusions of this article will be made available by the authors, without undue reservation.
Ethics statement
The animal study was reviewed and approved by Charles Darwin University Animal Ethics Committee (project reference – A20031).
Author contributions
AH, HC and RR conceived the study and undertook the fieldwork. AH and RR conducted post-processing and data analysis. MA provided input around the application of artificial intelligence. All authors contributed to the article and approved the submitted version.
Funding
Funding for this project was provided by the Australian Commonwealth’s Department of Agriculture under the Biosecurity Innovation Program (project 202049).
Acknowledgments
We would like to thank Alison Haines and the team from Charles Darwin University Katherine Rural campus for assistance with fieldwork. The assistance of the North Australia Quarantine Strategy staff, especially Guy Weerasinghe is greatly acknowledged.
Conflict of interest
The authors declare that the research was conducted in the absence of any commercial or financial relationships that could be construed as a potential conflict of interest.
Publisher’s note
All claims expressed in this article are solely those of the authors and do not necessarily represent those of their affiliated organizations, or those of the publisher, the editors and the reviewers. Any product that may be evaluated in this article, or claim that may be made by its manufacturer, is not guaranteed or endorsed by the publisher.
References
AgEagle Aerial Systems Inc. (n.d). Ebee X and eMotion (Kansas, USA: AgEagle Aerial Systems). Available at: https://ageagle.com/drones/ebee-x/.
Agisoft LLC. (2022a). AgiSoft PhotoScan Professional (St. Petersburg, Russia: Agisoft LLC). Available at: https://www.agisoft.com/features/professional-edition/.
Agisoft LLC. (2022b). Agisoft metashape user manual: Professional edition, version 1.8 (St. Petersburg, Russia: Agisoft LLC). Available at: https://www.agisoft.com/pdf/metashape-pro_1_8_en.pdf.
Australian Bureau of Meteorology. (2022). Climate statistics for Australian locations (Commonwealth of Australia: Bureau of Meteorology). Available at: http://www.bom.gov.au/climate/averages/tables/cw_014932_All.shtml.
Bartoń K. (2022). MuMIn: Multi-Model Inference R package version 1.47.1. Available at: hhps://CRAN.R-project.org/package=MuMIn
Beaver J. T., Baldwin R. W., Messinger M., Newbolt C. H., Ditchkoff S. S., Silman M. R. (2020). Evaluating the use of drones equipped with thermal sensors as an effective method for estimating wildlife. Wildlife Soc. Bull. 44 (2), 434–443. doi: 10.1002/wsb.1090
Brack I. V., Kindel A., Oliveira L. F. B., Scales K. (2018). Detection errors in wildlife abundance estimates from Unmanned Aerial Systems (UAS) surveys: Synthesis, solutions, and challenges. Methods Ecol. Evol. 9 (8), 1864–1873. doi: 10.1111/2041-210X.13026
Brunton E. A., Leon J. X., Burnett S. E. (2020). Evaluating the efficacy and optimal deployment of thermal infrared and true-colour imaging when using drones for monitoring kangaroos. Drones 4 (2), 20. doi: 10.3390/drones4020020
Burke C., Rashman M., Wich S., Symons A., Theron C., Longmore S. (2019). Optimizing observing strategies for monitoring animals using drone-mounted thermal infrared cameras. Int. J. Remote Sens. 40 (2), 439–467. doi: 10.1080/01431161.2018.1558372
Burnham K. P., Anderson D. R. (2022). “Advanced issues and deeper insights”. in Model selection and multimodel inference: a practical information-theoretic approach. Eds. K. P. Burnham, D. R. Anderson (New York, USA: Springer-Verlag New York, Inc.).
Campbell H. A., Beyer H. L., Dennis T. E., Dwyer R. G., Forester J. D., Fukuda Y., et al. (2015). Finding our way: On the sharing and reuse of animal telemetry data in Australasia. Sci. Total Environ. 534, 79–84. doi: 10.1016/j.scitotenv.2015.01.089
Carter A., Potts J. M., Stephens J., Roshier D. A. (2022). A comparison of methods for monitoring a sparse population of the red fox (Vulpes vulpes) subject to lethal control using GPS telemetry, camera traps and sand plots. Wildlife Res. (East Melbourne) 50 (5), 366–380. doi: 10.1071/WR22017
Caughley G., Sinclair R., Scott-Kemmis D. (1976). Experiments in aerial survey. J. Wildlife Manage. 40, 290–300. doi: 10.2307/3800428
Choquenot D. (1995). Assessing visibility bias associated with helicopter counts of feral pigs in Australia's semi-arid rangelands. Wildlife Res. 22 (5), 569–577. doi: 10.1071/WR9950569
Chrétien L. P., Théau J., Ménard P. (2016). Visible and thermal infrared remote sensing for the detection of white-tailed deer using an unmanned aerial system. Wildlife Soc. Bull. 40 (1), 181–191. doi: 10.1002/wsb.629
Christie K. S., Gilbert S. L., Brown C. L., Hatfield M., Hanson L. (2016). Unmanned aircraft systems in wildlife research: current and future applications of a transformative technology. Front. Ecol. Environ. 14 (5), 241–251. doi: 10.1002/fee.1281
Civil Aviation Safety Regulations 1998 (Austl: NSW). Available at: https://www.legislation.gov.au/Details/F2022C00697.
Cowled B. D., Garner M. G., Negus K., Ward M. P. (2012). Controlling disease outbreaks in wildlife using limited culling: modelling classical swine fever incursions in wild pigs in Australia. Veterinary Res. 43 (1), 1–16. doi: 10.1186/1297-9716-43-3
Duffy J. P., Cunliffe A. M., DeBell L., Sandbrook C., Wich S. A., Shutler J. D., et al. (2018). Location, location, location: considerations when using lightweight drones in challenging environments. Remote Sens. Ecol. Conserv. 4 (1), 7–19. doi: 10.1002/rse2.58
ESRI Inc. (2021). ArcGIS Pro (Version 2.9) [Computer software] (California, USA: Environmental Systems Research Institute (ESRI) Inc). Available at: https://www.esri.com/en-us/arcgis/products/arcgis-pro/overview.
Fewster R. M., Pople A. R. (2008). A comparison of mark–recapture distance-sampling methods applied to aerial surveys of eastern grey kangaroos. Wildlife Res. 35 (4), 320–330. doi: 10.1071/WR07078
Fordham D., Georges A., Corey B., Brook B. W. (2006). Feral pig predation threatens the indigenous harvest and local persistence of snake-necked turtles in northern Australia. Biol. Conserv. 133, 379–388. doi: 10.1016/j.biocon.2006.07.001
Froese J. G., Smith C. S., Durr P. A., McAlpine C. A., van Klinken R. D. (2017). Modelling seasonal habitat suitability for wide-ranging species: Invasive wild pigs in northern Australia. PloS One 12 (5), e0177018. doi: 10.1371/journal.pone.0177018
Gonzalez L., Montes G., Puig E., Johnson S., Mengersen K., Gaston K. J. (2016). Unmanned Aerial Vehicles (UAVs) and artificial intelligence revolutionizing wildlife monitoring and conservation. Sensors 16 (1), 97. doi: 10.3390/s16010097
Hartig F. (2022). DHARMa: Residual Diagnostics for Hierarchical (Multi-Level / Mixed) Regression Models R package version 0.4.6. Available at: https://CRAN.R-project.org/package=DHARMa.
Havens K. J., Sharp E. (2015). Thermal imaging techniques to survey and monitor animals in the wild: a methodology (Amsterdam, Netherlands: Academic Press).
Hodgson A., Kelly N., Peel D. (2013). Unmanned aerial vehicles (UAVs) for surveying marine fauna: a dugong case study. PloS One 8 (11), e79556–e79556. doi: 10.1371/journal.pone.0079556
Hodgson J. C., Mott R., Baylis S. M., Pham T. T., Wotherspoon S., Kilpatrick A. D., et al. (2018). Drones count wildlife more accurately and precisely than humans. Methods Ecol. Evol. 9 (5), 1160–1167. doi: 10.1111/2041-210X.12974
Hone J. (2020). How many feral pigs in Australia? An update. Aust. J. Zoology 67 (4), 215–220. doi: 10.1071/ZO20077
Horwood P. F., McBryde E. S., Peniyamina D., Ritchie S. A. (2018). The Indo-Papuan conduit: a biosecurity challenge for Northern Australia. Aust. New Z. J. Public Health 42, 434–436. doi: 10.1111/1753-6405.12808
Howell L. G., Clulow J., Jordan N. R., Beranek C. T., Ryan S. A., Roff A., et al. (2021). Drone thermal imaging technology provides a cost-effective tool for landscape-scale monitoring of a cryptic forest-dwelling species across all population densities. Wildlife Res. (East Melbourne) 49 (1), 66–78. doi: 10.1071/WR21034
Jachmann H. (2001). Estimating abundance of African wildlife: an aid to adaptive management ((Massachusetts, USA: Kluwer Academic Publications).
Jones G. P. I. V., Pearlstine L. G., Percival H. F. (2006). An assessment of small unmanned aerial vehicles for wildlife research. Wildlife Soc. Bull. 34 (3), 750–758. doi: 10.2193/0091-7648(2006)34[750:AAOSUA]2.0.CO;2
Jung T. S., Hegel T. M., Bentzen T. W., Egli K., Jessup L., Kienzler M., et al. (2018). Accuracy and performance of low-feature GPS collars deployed on bison and caribou Rangifer tarandus. Wildlife Biol. 1), 1–11. doi: 10.2981/wlb.00404
Kays R., Crofoot M. C., Jetz W., Wikelski M. (2015). Terrestrial animal tracking as an eye on life and planet. Science 348, aaa2478. doi: 10.1126/science.aaa2478
Lenzi J., Barnas A. F., ElSaid A. A., Desell T., Rockwell R. F., Ellis-Felege S. N. (2023). Artificial intelligence for automated detection of large mammals creates path to upscale drone surveys. Sci. Rep. 13 (1), 947. doi: 10.1038/s41598-023-28240-9
Linchant J., Lhoest S., Quevauvillers S., Lejeune P., Vermeulen C., Semeki Ngabinzeke J., et al. (2018). UAS imagery reveals new survey opportunities for counting hippos. PloS One 13 (11), e0206413. doi: 10.1371/journal.pone.0206413
Lüdecke D., Ben-Shachar M., Patil I., Waggoner P., Makowski D. (2021). Performance: An R package for assessment, comparison and testing of statistical models. J. Open Source Software 6 (60), 3139. doi: 10.21105/joss.03139
Margenau L. L. S., Cherry M. J., Miller K. V., Garrison E. P., Chandler R. B. (2022). Monitoring partially marked populations using camera and telemetry data. Ecol. Appl. 32 (4), e2553–e2n/a. doi: 10.1002/eap.2553
Marschner I. (2011). The R journal: glm2: fitting generalized linear models with convergence problems. R J. 2 (3), 12–15. doi: 10.32614/RJ-2011-012
McMahon M. C., Ditmer M. A., Isaac E. J., Moore S. A., Forester J. D. (2021). Evaluating unmanned aerial systems for the detection and monitoring of moose in Northeastern Minnesota. Wildlife Soc. Bull. 45 (2), 312–324. doi: 10.1002/wsb.1167
Part 101 (Unmanned Aircraft and Rockets) Manual of Standards Instrument 2019 (Austl: NSW). Available at: https://www.legislation.gov.au/Details/F2022C00594.
Patterson C., Koski W., Pace P., McLuckie B., Bird D. M. (2015). Evaluation of an unmanned aircraft system for detecting surrogate caribou targets in Labrador. J. Unmanned Vehicle Syst. 4 (1), 53–69. doi: 10.1139/juvs-2015-0014@juvs-vi.2016.01.issue-1
R Core Team. (2022). R: A language and environment for statistical computing (Vienna, Austria: R Foundation for Statistical Computing). Available at: https://www.R-project.org/.
Santangeli A., Chen Y., Kluen E., Chirumamilla R., Tiainen J., Loehr J. (2020). Integrating drone-borne thermal imaging with artificial intelligence to locate bird nests on agricultural land. Sci. Rep. 10 (1), 1–8. doi: 10.1038/s41598-020-67898-3
Sharp T. (2012). Pest Smart standard operating procedure PIG001: Trapping of feral pigs (Canberra: The Centre for Invasive Species Solutions). Available at: https://www.pestsmart.org.au/wpcontent/uploads/2018/02/171221_SOP_PIG001_web.pdf.
Stokes H. J., Mortimer J. A., Laloë J. O., Hays G. C., Esteban N. (2023). Synergistic use of UAV surveys, satellite tracking data, and mark-recapture to estimate abundance of elusive species. Ecosphere 14 (3), e4444. doi: 10.1002/ecs2.4444
Sudholz A., Denman S., Pople A., Brennan M., Amos M., Hamilton G. (2021). A comparison of manual and automated detection of rusa deer (Rusa timorensis) from RPAS-derived thermal imagery. Wildlife Res. (East Melbourne) 49 (1), 46–53. doi: 10.1071/WR20169
Taylor D. L., Leung L. P., Gordon I. J. (2011). The impact of feral pigs (Sus scrofa) on an Australian lowland tropical rainforest. Wildlife Res. 38 (5), 437–445. doi: 10.1071/WR08138
Tomkiewicz S. M., Fuller M. R., Kie J. G., Bates K. K. (2010). Global positioning system and associated technologies in animal behavior and ecological research. Philos. Trans. R. Soc. B: Biol. Sci. 365 (1550), 2163–2176. doi: 10.1098/rstb.2010.0090
Whitworth A., Pinto C., Ortiz J., Flatt E., Silman M. (2022). Flight speed and time of day heavily influence rainforest canopy wildlife counts from drone-mounted thermal camera surveys. Biodiversity Conserv. 31 (13-14), 3179–3195. doi: 10.1007/s10531-022-02483-w
Wich S. A., Koh L. P. (2018). (Massachusetts, USA: Kluwer Academic Publications). Conservation drones: mapping and monitoring biodiversity (New York, USA: Oxford University Press).
Witczuk J., Pagacz S., Zmarz A., Cypel M. (2018). Exploring the feasibility of unmanned aerial vehicles and thermal imaging for ungulate surveys in forests - preliminary results. Int. J. Remote Sens. 39 (15-16), 5504–5521. doi: 10.1007/s10531-022-02483-w
Keywords: wildlife survey, feral pig, Sus scrofa, GPS tracking, drone, unmanned aerial vehicle
Citation: Hvala A, Rogers RM, Alazab M and Campbell HA (2023) Supplementing aerial drone surveys with biotelemetry data validates wildlife detection probabilities. Front. Conserv. Sci. 4:1203736. doi: 10.3389/fcosc.2023.1203736
Received: 11 April 2023; Accepted: 07 August 2023;
Published: 25 August 2023.
Edited by:
Emily Bennitt, University of Botswana, BotswanaReviewed by:
Andrea Presotto, Salisbury University, United StatesWon Young Lee, Korea Polar Research Institute, Republic of Korea
Copyright © 2023 Hvala, Rogers, Alazab and Campbell. This is an open-access article distributed under the terms of the Creative Commons Attribution License (CC BY). The use, distribution or reproduction in other forums is permitted, provided the original author(s) and the copyright owner(s) are credited and that the original publication in this journal is cited, in accordance with accepted academic practice. No use, distribution or reproduction is permitted which does not comply with these terms.
*Correspondence: Hamish A. Campbell, hamish.campbell@cdu.edu.au